General information

Bluetooth Monitor provides information about Bluetooth environment. The app displays information about the adapter, as well as data about found and paired devices. In addition, you can analyze the signal strength of Bluetooth devices on the chart. Information is collected in the background and controlled by a button in the upper right corner of the screen.

Monitoring start and stop

Measurements of Bluetooth parameters are performed by background service. It can be started or stopped by clicking on the button in the top bar of the application. An icon appears in the notification area when background service is on.

User interface

The application contains four sections in the tabs Overview, Scanned devices list, Paired devices list, and Signal strength chart. In addition to tapping a tab, you can switch between them by swiping left and right.

Overview

Bluetooth Monitor

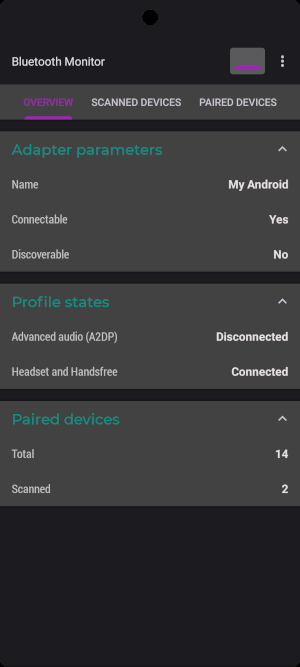
The Overview tab consists of four collapsible sections. The first section shows Bluetooth adapter parameters: name, connectable, discoverable. The next sections show the state of 'Advanced audio' and 'Headset and Handsfree' profiles. The final block contains information about paired (bonded) devices: total number and number of devices detected during scanning.

Scanned devices list

Bluetooth Monitor

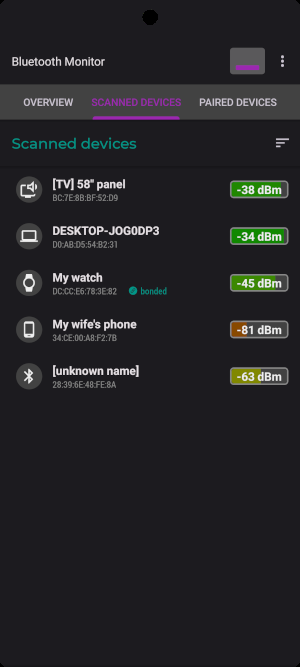
This tab lists all Bluetooth devices found nearby. Each entry shows a device-type icon, name, MAC address, manufacturer (when available), connection mode (Low energy, Dual mode, or Classic), and signal strength (RSSI in dBm). Paired devices are marked with a 'bonded' status. Use the sort icon next to the section header to set the order of items in the list.

Paired devices list

Bluetooth Monitor

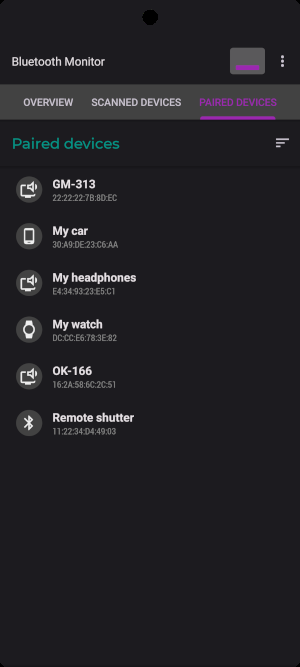
This tab lists all devices bonded with your device. Each entry shows an icon by device type, name, MAC address, manufacturer or type, and connection mode (Low energy, Classic, or Dual mode). A sort button next to the Paired devices header helps to organize the list.

Signal strength chart

Bluetooth Monitor

This tab shows a real-time line chart of RSSI (signal strength in dBm) over time for found Bluetooth devices. The Y-axis is signal strength (from -100 to -20 dBm), the X-axis is time. Each device has a distinct colored line; a legend lists device names and their colors. The chart updates every second, so you can see how signal strength changes.

App stores